Annotation Project Tutorial (2D)
This tutorial will guide you through the steps to create a 2D annotation project. Follow the instructions carefully to set up your project successfully.
Step 1: Dataset Selection
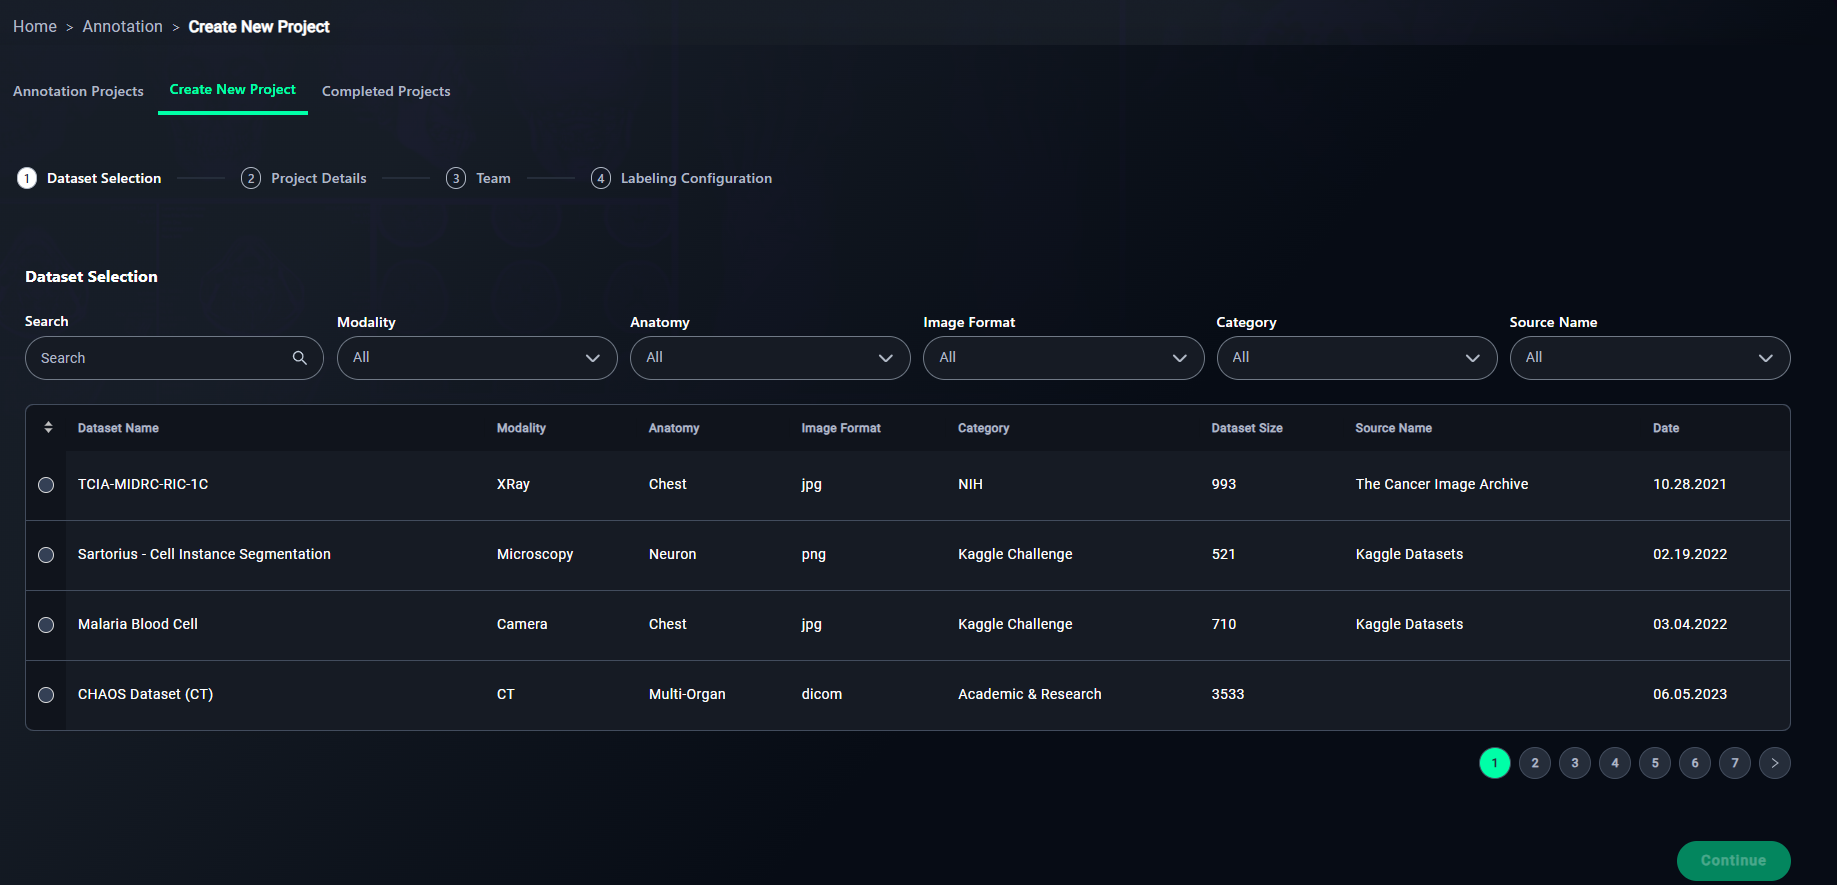
1. Search
- Use the search bar to locate your dataset by name.
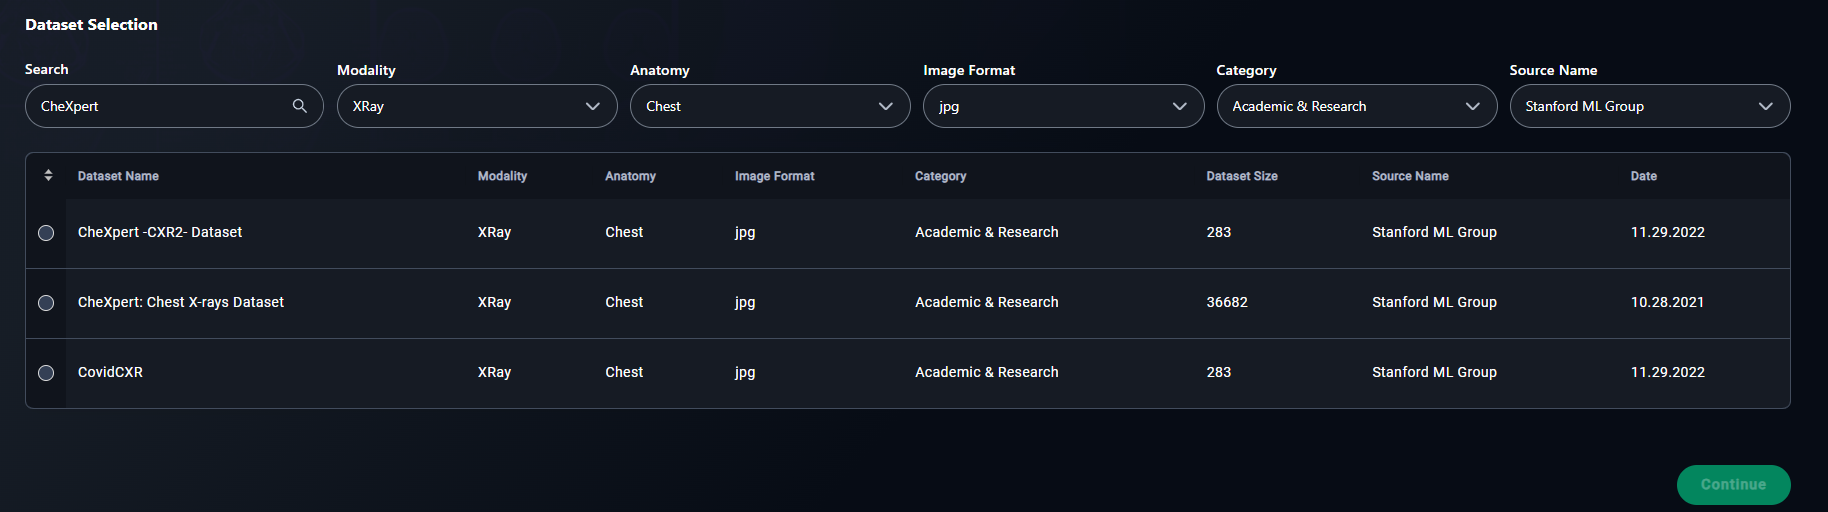
- Type "CheXpert" in the search bar to find the CheXpert: Chest X-rays Dataset dataset.

2. Apply Filters
- Refine your search using filters:
- Select filters such as:
- Modality: Choose the data type (e.g., XRay, CT).
- Anatomy: Filter by regions like Chest or Neuron.
- Image Format: Select JPG, PNG, or DICOM.
- Category: Choose the source (e.g., NIH).
- Source Name: Specify the source name (e.g., "The Cancer Image Archive").
- Select filters such as:
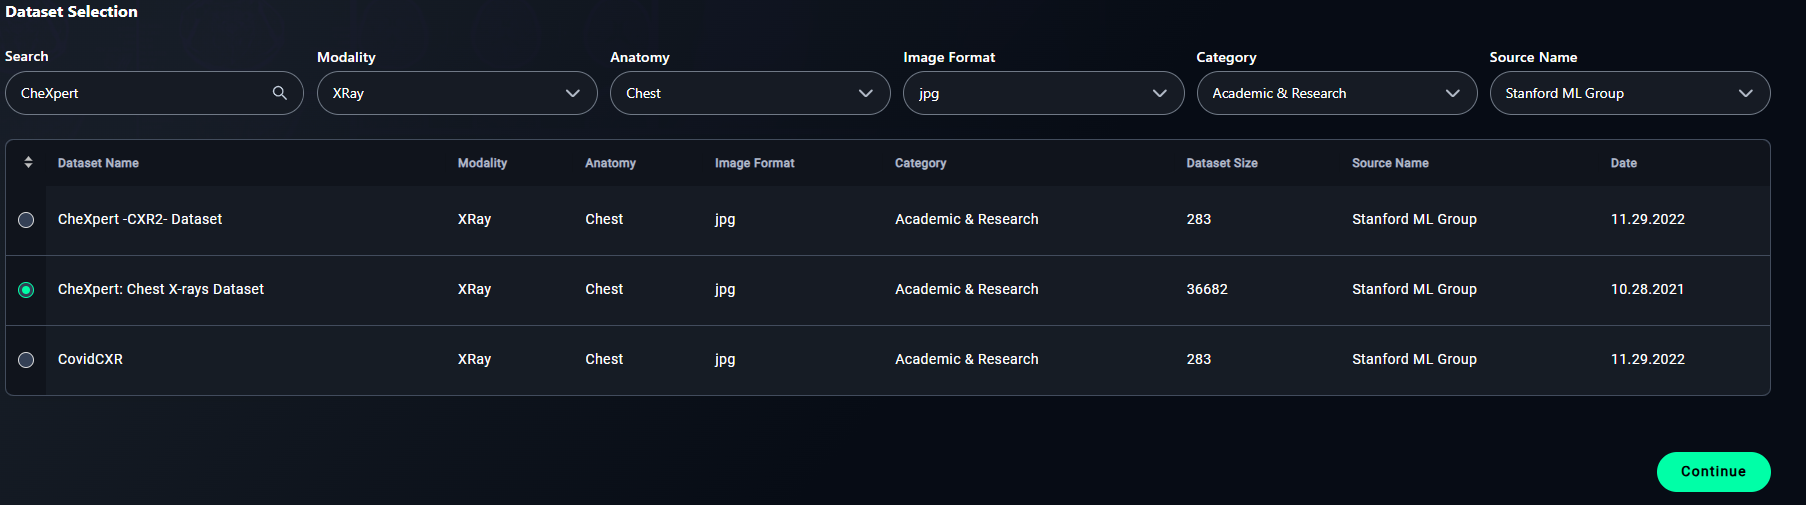
3. Select a Dataset
- Click the radio button for your chosen dataset.
- Example: Select CheXpert: Chest X-rays Dataset.
5. Proceed
- Click Continue to move to the next step: Project Details.
Step 2: Project Details
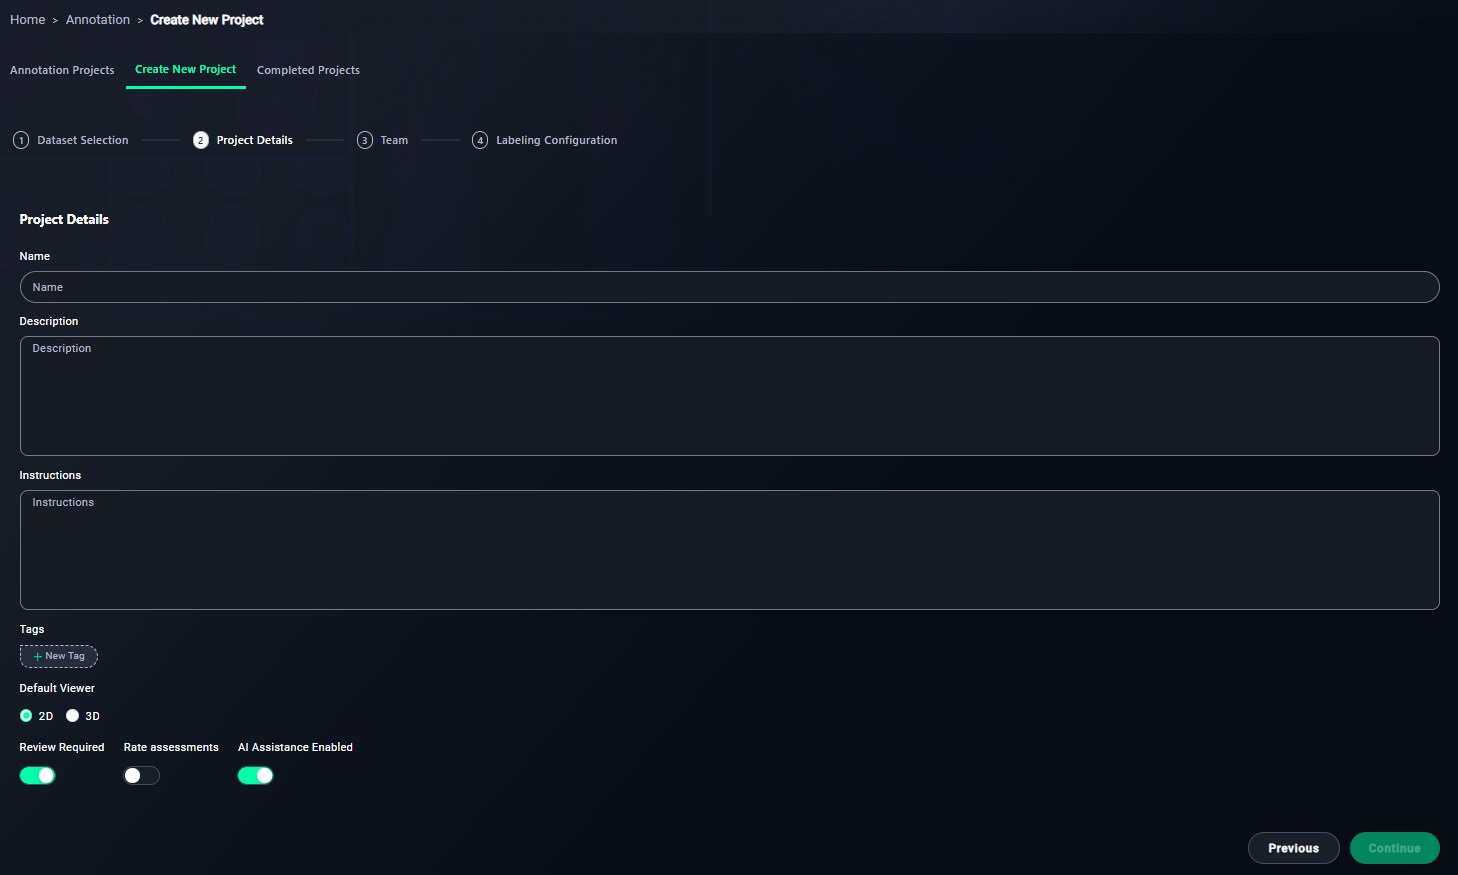
1. Name Your Project
- Enter a meaningful name for your project.
- Type
Chest X-Ray Annotation Project.
- Type

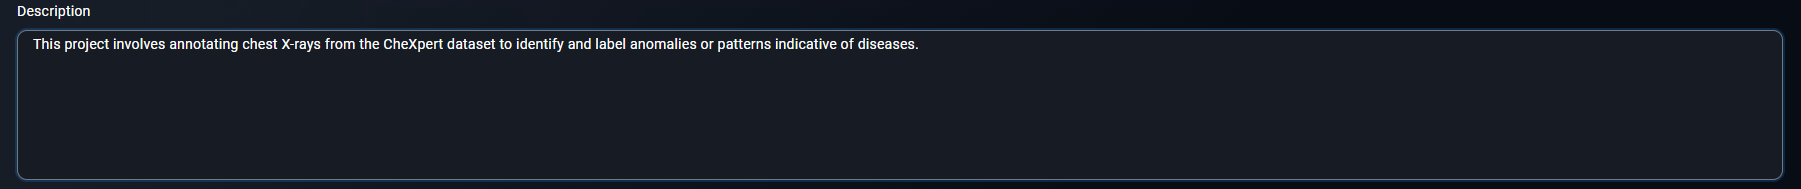
2. Write a Description
- Provide an overview of the project's objective.
- Write a description like:
This project involves annotating chest X-rays from the CheXpert dataset to identify and label anomalies or patterns indicative of diseases.
- Write a description like:
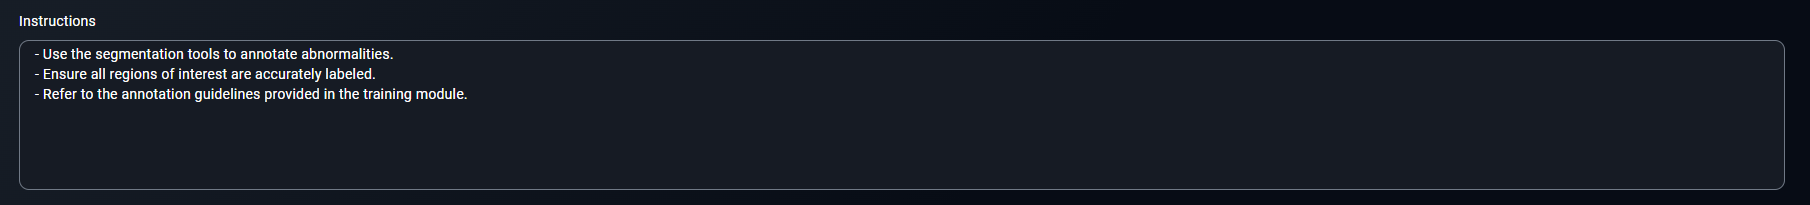
3. Provide Annotator Instructions
- Write step-by-step instructions for annotators.
- Include points such as:
- Use the segmentation tools to annotate abnormalities.
- Ensure all regions of interest are accurately labeled.
- Refer to the annotation guidelines provided in the training module.
- Include points such as:
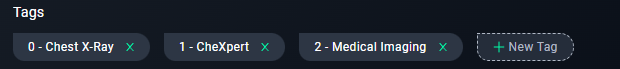
4. Add Tags
- Use tags to categorize the project.
- Add tags like
Chest X-Ray, CheXpert, Medical Imaging.
- Add tags like
5. Configure Viewer Settings
-
Keep the viewer set to 2D.
- Ensure the 2D Viewer option is selected.

6. Enable Review Requirements
- Keep this enabled to ensure all annotations are reviewed.
7. Optional: Rate Assessments
- Enable this if annotators need to rate task difficulty.
8. Enable AI Assistance
- Turn this on if you want AI to assist in annotations.

9. Proceed
- Click Continue to move to the next step: Team.
Step 3: Team
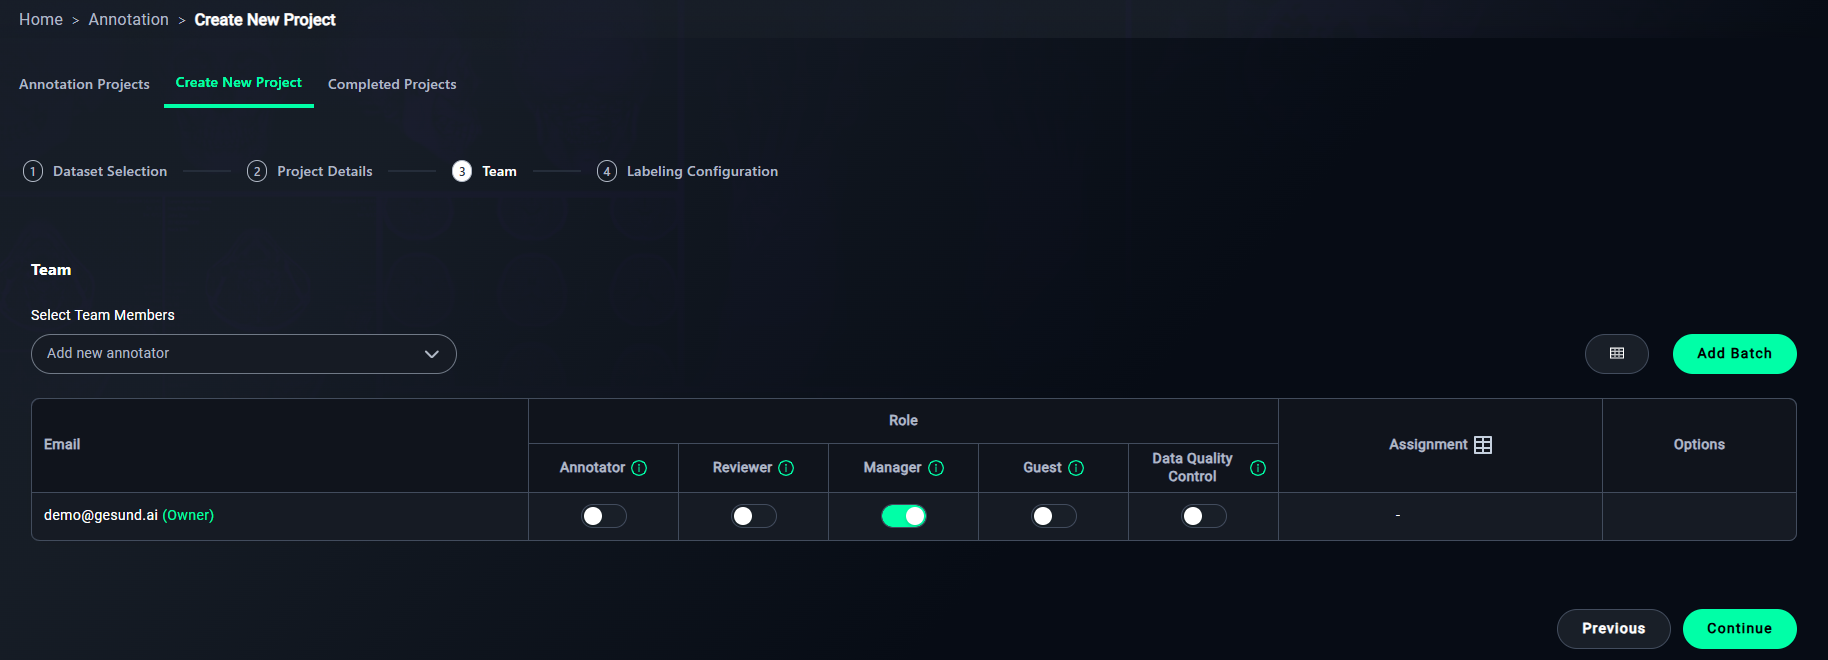
1. Add Annotators
- Add team members via email.
- Select a reader from the dropdown.
- You can see owner of the project at email column.

2. Assign Roles
- Assign roles to team members:
- Enable the features you want for the readers you want:
- Annotator: For labeling data.
- Reviewer: For reviewing annotations.
- Manager: For managing the project.
- Guest: For limited access.
- Data Quality Control: For overseeing annotation quality.
- Enable the features you want for the readers you want:

3. Set Assignments
- Assign datasets to team members.
- Click the assignment icon in the Annotator column to open the Assignment Modal.
4. Proceed
- Click Continue to move to Step 4: Labeling Configuration.
Assignment Modal
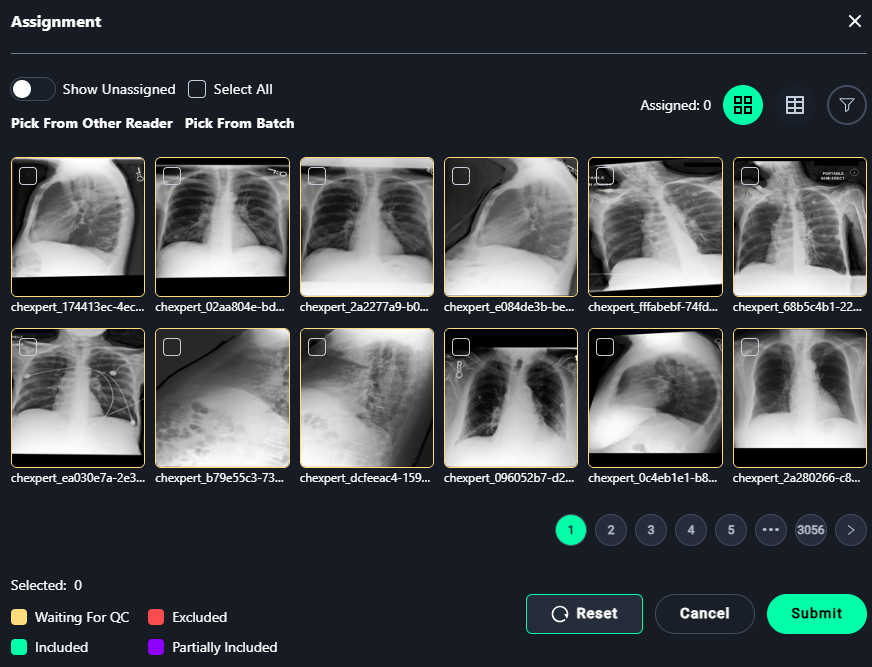
1. Select Images
- Assign images for annotation:
- Select individual images or use Select All to assign all visible images.
2. Finalize Assignments
- Click Submit to save the assignments.
- Use Reset to clear all selections.
Step 4: Labeling Configuration
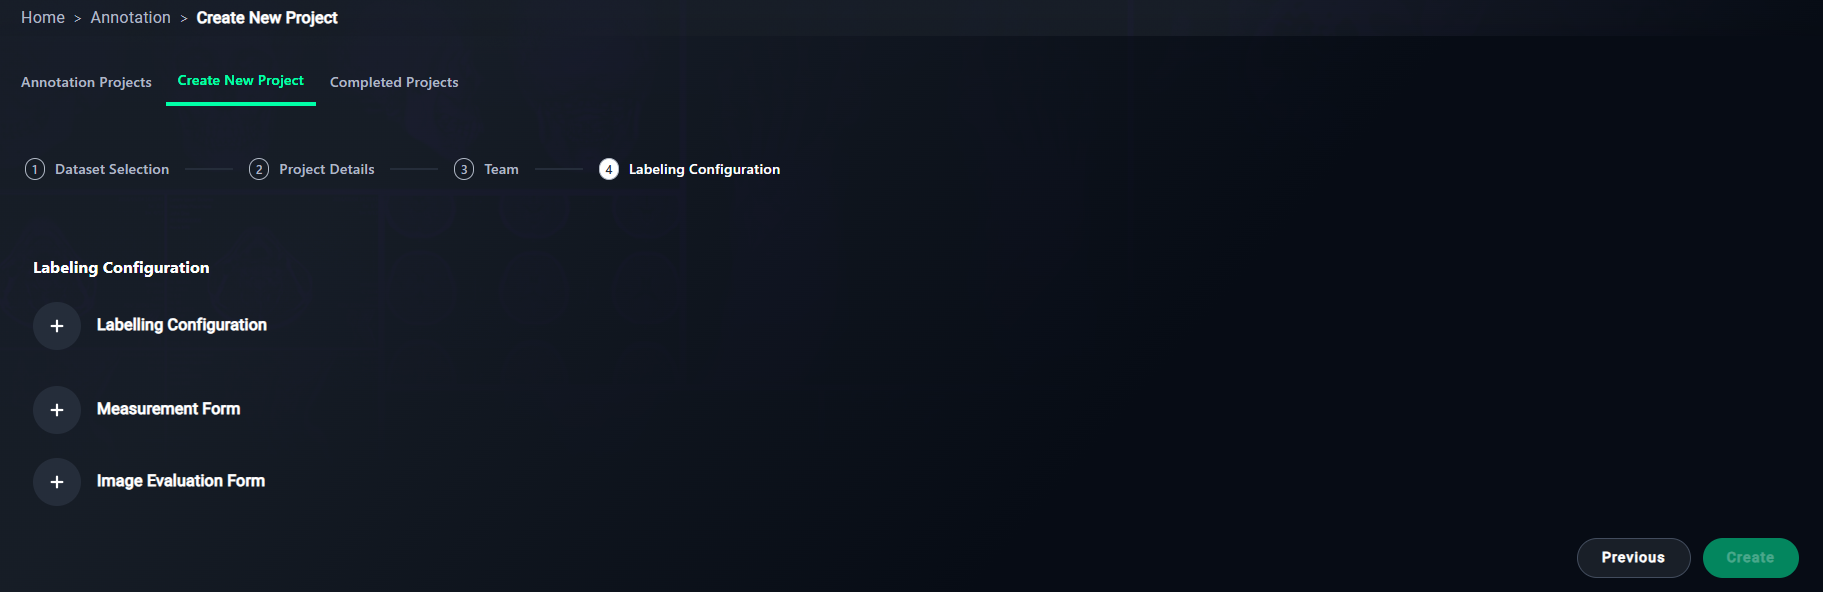
1. Add Labeling Configuration
- Set up labels for the project.
- Click + Labeling Configuration.
2. Optional: Add Measurement Form
- Define metrics for annotations.
- Click + Measurement Form.
3. Optional: Add Image Evaluation Form
- Add criteria for evaluating image quality.
- Click + Image Evaluation Form.
4. Finalize Configuration
- Click Create to save and finalize your project setup.
New Labeling Configuration Modal
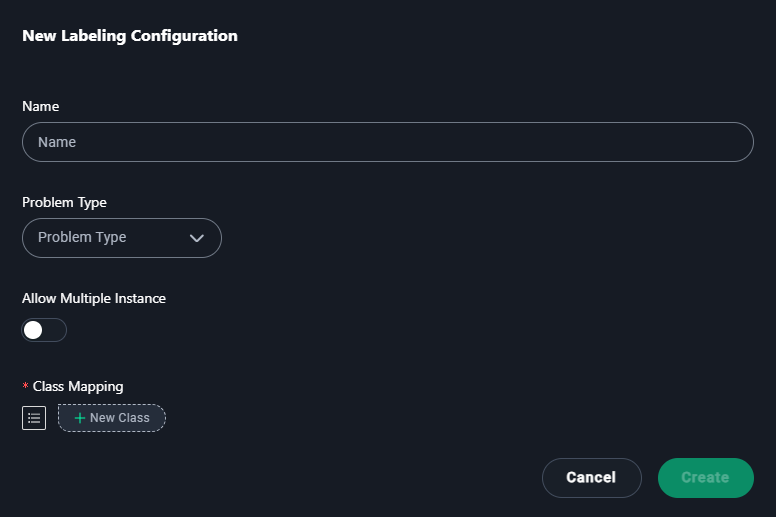
1. Name
- Enter a descriptive name for the labeling configuration.
- Type
CheXpert: Chest X-Ray Anomaly Detection.
- Type

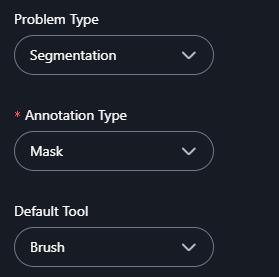
2. Problem Type
- Select the type of annotation problem:
- Classification
- Segmentation
- Semantic Segmentation
- Instance Segmentation
- Object Detection

3. Annotation Type (Segmentation is selected at example)
- If you select Segmentation as the problem type, choose an annotation type:
- Polygon: Use this for freehand or custom-shaped annotations.
- Mask: Use this for pixel-level annotations to label areas with high precision.

4. Default Tool (If Mask is Selected)
- If Mask is chosen as the annotation type, select a default tool:
- Brush: For painting regions manually with a brush-like tool.
- Freehand Scissors: For drawing freehand outlines to define regions.
- Correction Scissors: For modifying or correcting existing masks.
5. Allow Multiple Instances
- Enable this if multiple annotations of the same type are needed.
- Example: Enable if annotating multiple lesions.
4. Add Classes
- Add categories for annotations:
- Click + New Class and add
background, lung.
- Click + New Class and add

5. Save
- Click Create to save the configuration.
New Measurement Form Modal
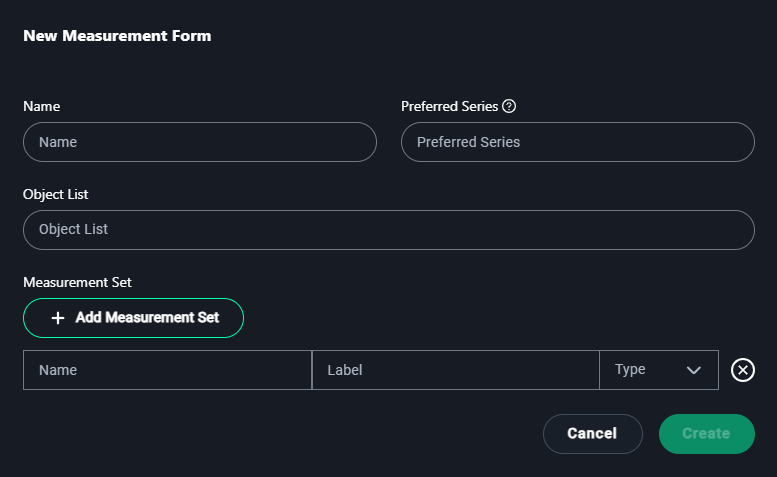
1. Name
- Enter a name for the measurement form that reflects its purpose.
Example:CheXpert X-Ray Measurements

2. Preferred Series
- Specify the preferred dataset series if applicable.
Example:CheXpert Chest X-Rays

3. Object List
- Add objects for which measurements will be made.
Example:Lesions, Tumors

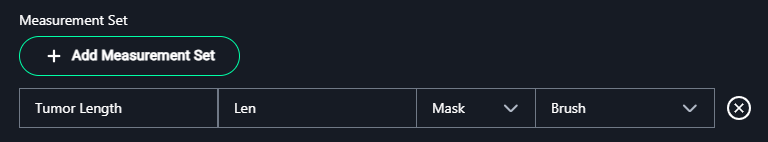
4. Measurement Set
- Click + Add Measurement Set to define the types of measurements required:
- Name: Enter the name of the measurement.
- Example:
Tumor Length
- Example:
- Label: Provide a short label or abbreviation for the measurement.
- Example:
Len
- Example:
- Type: Select the measurement type from the dropdown options:
- Length: For linear measurements.
- Polygon: For freehand shape measurements.
- Angle: For angular measurements.
- Cobb Angle: Specific for spine curvature.
- Mask: For segmented regions.
- Bidirectional: For width and height measurements.
- Rectangle: For bounding box measurements.
- Point: For single coordinate annotations.
- Name: Enter the name of the measurement.
5. Create
- Once the details are configured, click Create to save the measurement form.
New Image Evaluation Modal
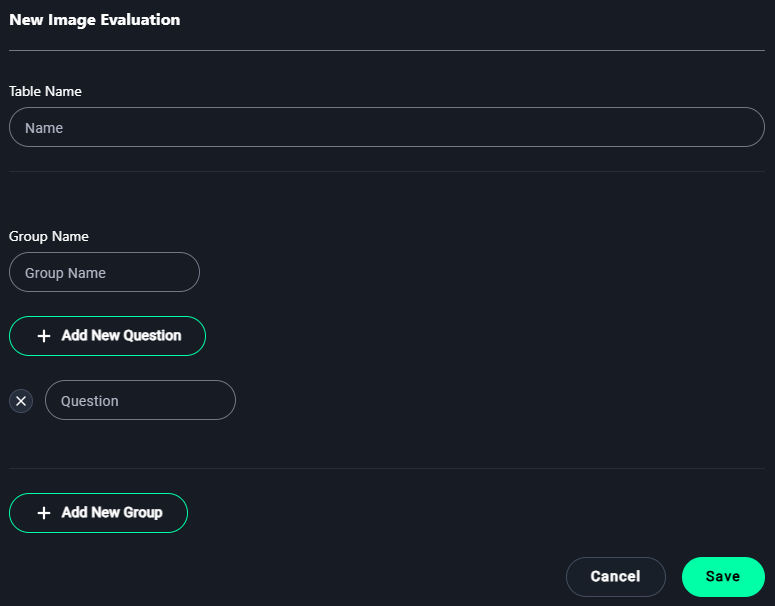
1. Table Name
- Enter a name for the evaluation table to describe its purpose.
Example:CheXpert X-Ray Quality Evaluation

2. Group Name
- Add a group name to organize related evaluation questions.
Example:Image Clarity

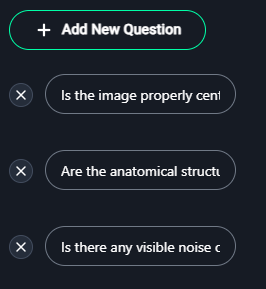
3. Add Questions
- Click + Add New Question to define criteria for evaluation.
Examples of questions:- "Is the image properly centered?"
- "Are the anatomical structures clearly visible?"
- "Is there any visible noise or artifact?"
4. Add New Groups (Optional)
- Click + Add New Group to categorize questions further.
Example:- Group Name:
Anatomy Visibility
Questions:- "Are the lungs fully visible?"
- "Is the heart region clearly outlined?"
- Group Name:
5. Save
- After adding all necessary groups and questions, click Save to finalize the image evaluation form.
Accessing Your Project
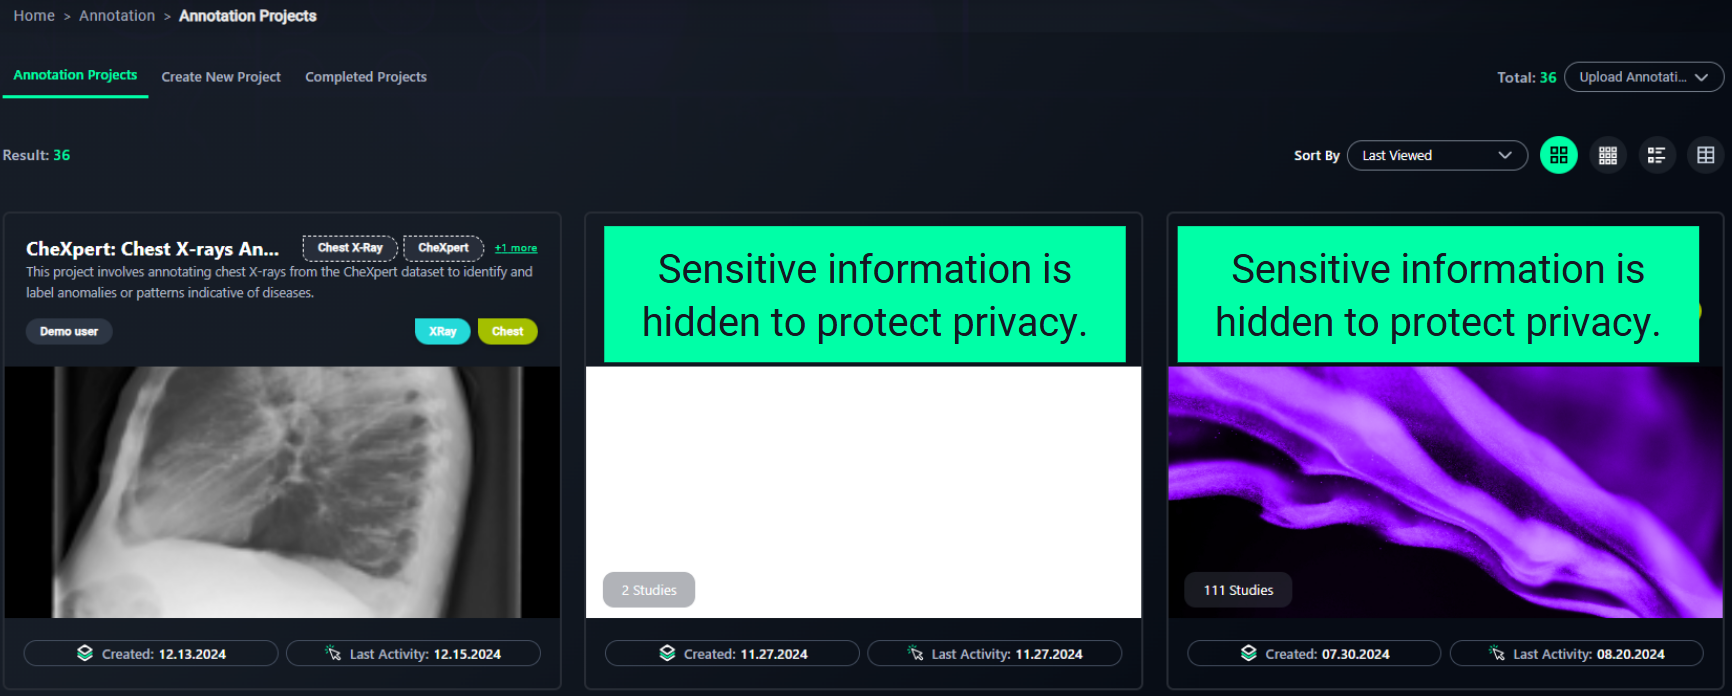
1. Locate Your Project
- The Annotation Projects dashboard displays all existing projects.
- Projects are shown as cards containing:
- Project Name: Describes the project's purpose (e.g., Chest X-Ray Annotation Project).
- Created Date: When the project was created.
- Last Activity: The most recent action performed.
2. Identify the Project Card
- Locate the card corresponding to your desired project.
Example: Look for "Chest X-Ray Annotation Project."
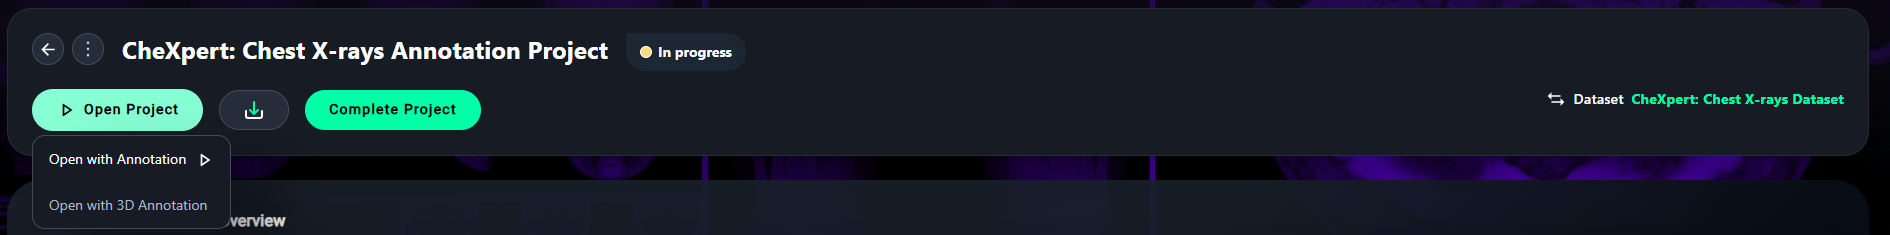
3. Click on the Project Card
- Click the project card to open it and view detailed options, such as annotations, settings, or project statistics.
4. Open the Project
- Click Open Project and select your preferred annotation mode:
- Open with Annotation for 2D projects. (Click on this for example project)
- Open with 3D Annotation for 3D-enabled datasets.
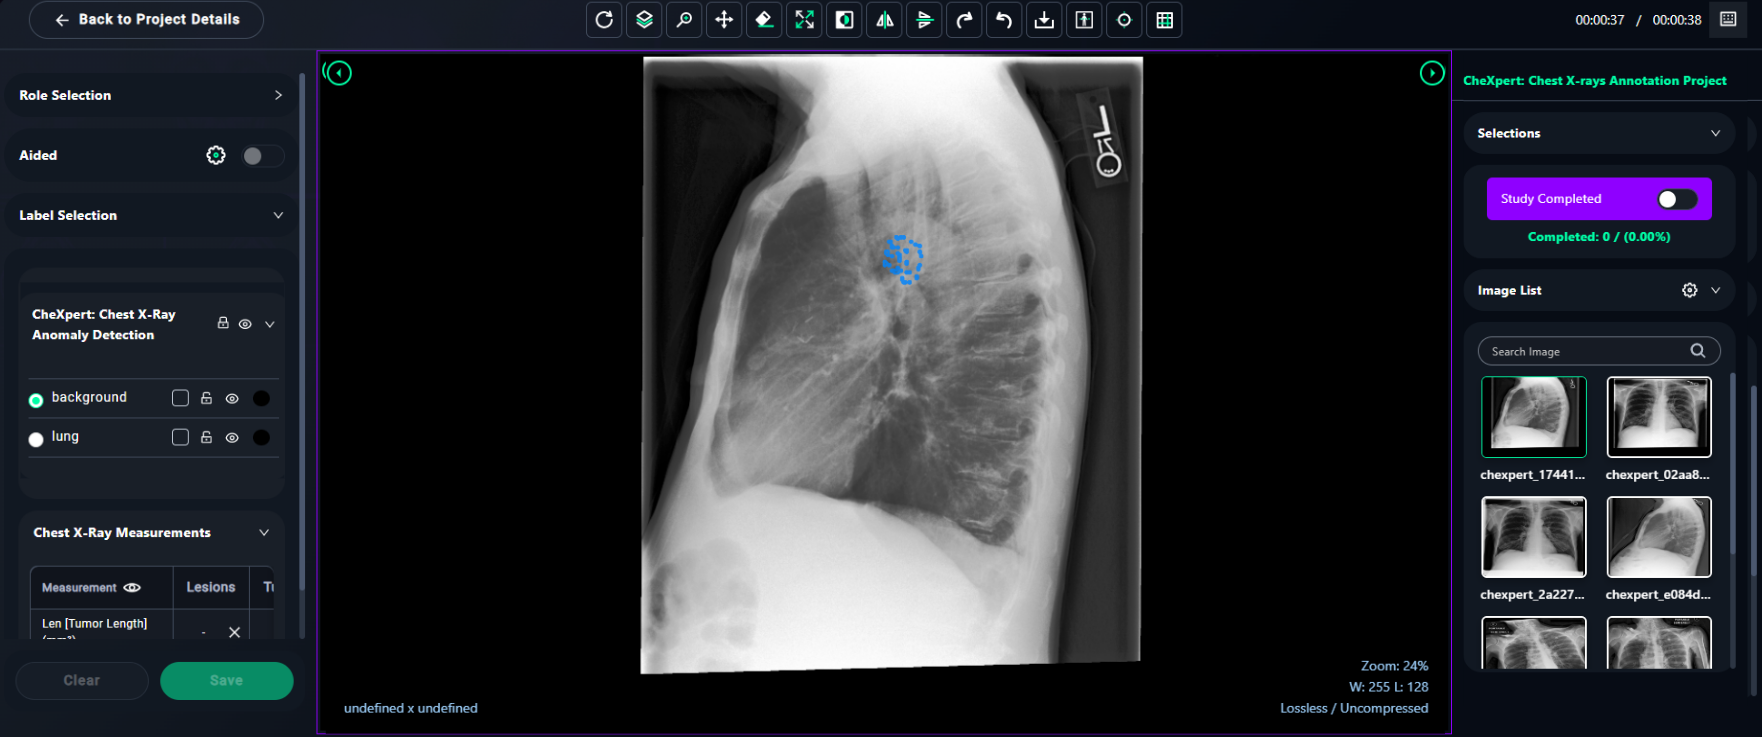
Annotation Viewer Page (2D)
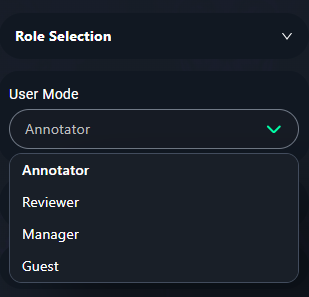
1. User Mode Options
- Select the appropriate User Mode from the dropdown menu:
- Annotator: Choose this if you will be labeling or annotating data. (Select Annotator option to make segmentations.)
- Reviewer: Select this if your task is to review and validate annotations.
- Manager: This role is for managing the project and its configurations.
- Guest: Use this mode for limited access, such as observing project progress.
2. Select Labels for Annotation
- From the Label Selection panel, choose the appropriate label for the region you want to annotate:
- Example Labels:
- Normal Tissue: Use for areas with no abnormalities.
- Pneumonia: Label suspected pneumonia regions.
- Tumor: Mark areas suspected to contain tumors.
- Example Labels:
3. Use Segmentation Tools
- Access the segmentation tools from the toolbar:
- Brush Tool: Use this tool for brush, freehand, scissor, threshold brush options. Adjust size, opacity, and brush threshold using the Brush Configs in the Segment Tools panel.
- Eraser Tool: Correct any mistakes by erasing unwanted annotations.
- For Brush Tool Settings:
- Adjust Opacity to control annotation visibility.
- Use the Brush Radius slider to change the size of the brush.
- Toggle Smart Segmentation for AI-assisted segmentation.
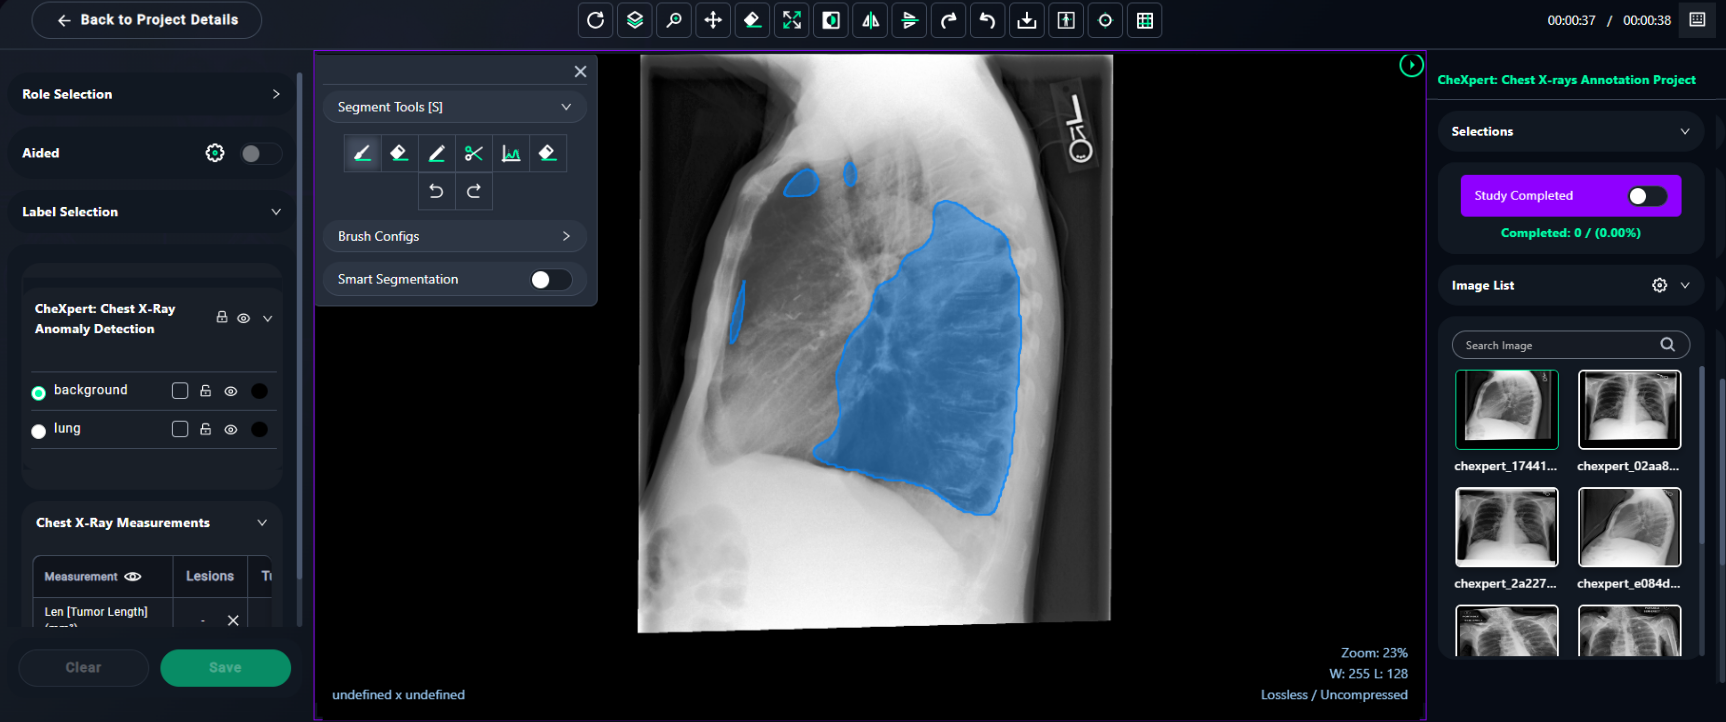
4. Draw the Labels
- With the selected tool and label:
- Click and drag on the image to annotate the chosen region.
- Ensure the labeled area corresponds to the selected label (e.g., Normal Tissue, Pneumonia, Tumor).
5. Save and Review
- Once the annotation is complete:
- Click Save to finalize your work.
- Use the Study Completed toggle to mark the current image as fully annotated.
6. Image Selection and Navigation
- Selections Panel:
- Toggle the Study Completed switch to mark the current image as fully annotated once your work is finished.
- Monitor progress through the Completed counter, which shows the number of completed images and the overall percentage.

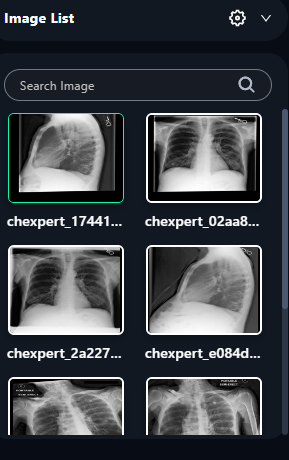
- Image List:
- Use the search bar to locate a specific image by its name or identifier.
- Scroll through the list to select the image you want to annotate.
- Click on an image to load it into the annotation viewer for labeling.
7. Saving Progress
- Always click Save after completing annotations on an image to ensure your work is stored.
- Use the Study Completed toggle to update the project's progress and indicate completed studies.
Toolbar Functions Overview

Explanation of each tool from left to right:
1. Reset
- Resets the image to its default zoom level and orientation.
2. Segment Tools
- Opens the segmentation tools panel for annotating and labeling regions in the image.
3. Hide Segments
- Toggles the visibility of existing annotations or segments on the image.
4. Stack Scroll
- Allows navigation through a series of stacked images or slices, useful for multi-frame datasets.
5. Zoom
- Adjusts the zoom level for closer inspection or a broader view of the image.
6. Pan
- Enables dragging of the image across the workspace for better positioning.
7. Erase Tool
- Activates the eraser to remove unwanted annotations or markings.
8. Fit to Window
- Scales the image to fit the available workspace entirely.
9. Invert
- Inverts the image colors, useful for enhanced visibility of certain features.
10. HFlip
- Flips the image horizontally.
11. VFlip
- Flips the image vertically.
12. Rotate Right
- Rotates the image 90 degrees clockwise.
13. Rotate Left
- Rotates the image 90 degrees counterclockwise.
14. Download
- Downloads the annotated image or the original image to your local device.
15. Reference Tool
- Opens the reference panel to compare the current image with a reference image.
16. Drag Probe
- Activates the drag probe for inspecting pixel values or other metadata.
17. Grid View
- Toggles the display of a grid overlay for alignment and precision during annotation.